TLT ETF: Long-Dated U.S. Treasuries Are A Generational Buy
https://seekingalpha.com/article/4647767-tlt-long-dated-us-treasuries-are-a-generational-buy


- My macro outlook for 2024 predicts a recession and strong disinflation in major economies.
- The flatter yield curve, the Fed's pause and many other factors create a favorable environment for long-dated Treasuries.
- Long-dated Treasuries are now considered a defensive, risk-off asset class and offer an attractive risk-reward opportunity.
- Investing through target-maturity vs. fixed maturity has individual trade-offs.
US Treasury, TLT ETF
wsmahar
My macro outlook favors long-dated Treasuries
My macro outlook for 2024 is that we will see an average recession and strong disinflation in major economies, including the US and the EU. While I expect continued inflationary pressures from oil and gas, most other commodities and factors will be disinflationary. So, the overall inflation should be under control. Probably falling to ~3% p.a. but not getting to 2% p.a., outside of a strong recession.
So far, the Fed's steep interest rate increases affected just the variable rate debt and anyone refinancing within a year or two. The major effects of the rate hikes are delayed and yet to come.
Similarly, the effect of the recent inflation spike is still not fully felt. As the current permanently higher consumer price level sets in, more and more people will need to purchase larger-ticket items at new prices. More and more people will be gradually "maxed out" of their excess savings, hurting spending and investments.
The steeply inverted yield curve (wait, not anymore)
The strongly inverted yield curve also delayed the negative impact of swiftly rising rates because companies (including banks) and individuals have been able to use their existing cheap debt while depositing excess cash at a higher rate, effectively having a positive interest margin. This is very similar to how bank lending operates. However, the long end of the curve has recently almost fully caught up with the short end (not entirely though). There is still some positive spread from holding short-term debt. Also, the high long rates mean that instead of rolling debt, some companies and individuals will decide it is not worth it at current high rates, and will deleverage, selling houses, cancelling investments, etc.

Ustreasuryyieldcurve.com
The market now prices in current rates "forever"
The flattish curve is a game-changer. This situation no longer motivates investors to stay in short-dated debt. There is no benefit, in terms of the yield. Staying in short debt is just an expression of defensiveness or diversification, etc. What happens when short rates start falling in expectation of the Fed starting to cut rates? The trillions of dollars parked in this short-end cash will move. Where? Part of it will venture into stocks and other risk assets, if these rate-cut expectations are based on healthy falling inflation, not a recession. If the rate cuts are a sign of financial or economic troubles and a recession fear, most of the money will move to longer-dated Treasuries. This sudden demand surge has almost always historically led to very attractive gains in long-dated Treasury investments. I understand the bearish arguments of high supply and falling demand by foreign investors and governments. However, I believe the amount of money parked on the sidelines currently is so large that when investors start moving them out, it will overwhelm all other factors, for many months and with strong impact on yields.
The Fed is on pause
The Fed is in a wait-and-see mode. Unless absolutely necessary, they will now prefer to keep rates high for longer, but not higher. Each incremental raise from these levels has diminishing returns in terms of positive goals the Fed tries to achieve (slow down the economy and inflation). On the other side, each hike now bears an exponentially higher risk of "breaking something". The UK pension system almost broke at rates of 4%. The weakest smaller banks broke soon after. Some banks are under-water on positions in long-dated Treasuries already. So could be some US pension funds. The government must issue incremental debt just to pay the increased interest. So, the Fed will not raise more, unless absolutely necessary.
The Fed put under US Treasuries
The current flat yield curve, together with the Fed on hold, serves as a "Fed put" under long-term Treasuries. There is no longer an incentive to move to the short end. If long yields rise above the short end from this level, there will be an outright incentive to move to longer-duration debt to benefit from the traditional positive roll yield (term premium).
The risk assets vs. Treasuries
Risk assets like stocks don’t care about interest rates too much when rates are below 5. However, rates above 5% on the short or long end (or both) will start to have an outsized impact on the prices of risk assets. A risk-free rate above 5% would truly start sucking money out of risk assets like stocks, because it gets uncomfortably close to the long-term expected total returns of many risky asset classes. The tiny risk premiums would not be worth the risk. A swift, strong bear market in risk assets would add to the risk of "something breaking", and would reintroduce rate cut expectation to the yield curve. The Fed would likely to step in one way or another.
The magic number 5: Psychology matters
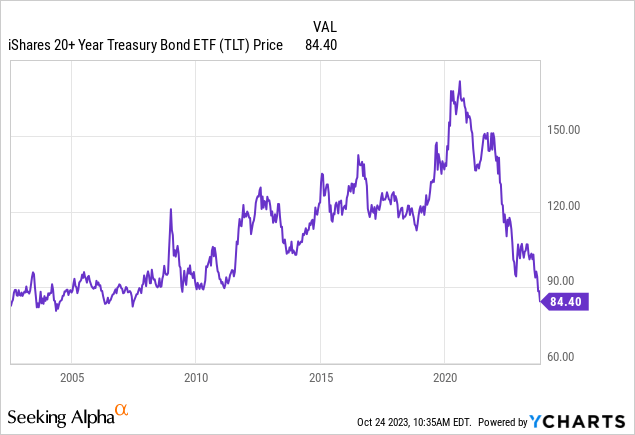
The inverse P/E of ~20x implies an earnings yield of around 5%. While stocks offer more than just yield (future growth potential of earnings), this 5% no-growth stock yield is the same as the risk-free rate. Something to consider separately. Another psychological importance of the number 5 is that it is a half-round number, It is also the highest level since 2007 and a level around which 30Y rates oscillated during the 2002-2007 cycle. Moreover, there has been a ~50% drawdown from the top reached in November 2020 and a slightly lower peak from November 2021 in terms of the price of the iShares 20+ Year Treasury Bond ETF (NASDAQ:TLT) (dividends excluded). Losing almost half the money in around two years in a fixed income instrument is a shock to many holders. Many individual investors have capitulated already. The sentiment is mostly negative. The implied and realized volatility of the TLT ETF, the VXTLT index, is high. The MOVE index of US Treasury volatility is high, both suggesting substantial stress priced in for the asset class already.
Treasuries are now a defensive asset again
During the interest rate hikes, longer-dated Treasuries stopped working as a risk-off hedge. They’ve been in a bear market for the third year now, their longest bear market ever. However, they’ve finally repriced to the "correct" new level of expected inflation plus real yields. At high yields, Treasuries will now again be working, in fact even better than before, as a good defensive hedge, as well as a portfolio diversifier (negative correlation with stocks will return on average). The most recent proof that Treasuries are again considered a defensive, risk-off asset class, is their reaction to the tragic events that happened to Israel.
Risk-reward skewed to the upside
There are risks to all investments. Multiple risks could lead to further rise in yields. However, if long-dated yields rise from the current 5% level to 8% (rise of 3 percentage points), the market price of a government bond with a maturity in 20 years will fall roughly by 30%. However, if rates fall by the same 3 percentage points from the current 5% to 2%, the price of the same bond would rise roughly by 50%. Moreover, investors are getting the current 5% p.a. yield on the nominal regardless of what happens to the interest rates. So, the realistic downside risk is significantly smaller than the upside potential. True, if long-dated rates spike to 15%, like in the 70s, the bond price would fall ~63%. But there would be the annual yield of 5% every year on the purchase value of the bonds. Similarly, if rates fall to almost zero on the long end, the bond price would roughly double. Again, there would be an annual yield of 5%.

Fidelity
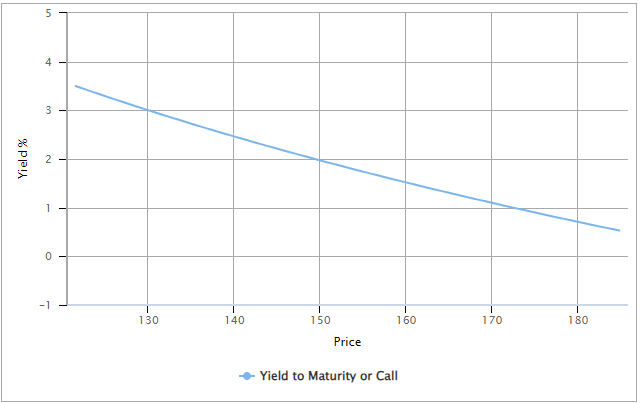
Fidelity
Source: Fidelity
How to invest in long-dated US Treasuries?
A constant-maturity ETF, like TLT, will keep the maturity at roughly the same length indefinitely. It means it has to sell individual bonds from its portfolio when their maturity drops to 20 years and buy longer-dated bonds. This systematic rolling of positions means that the fund can make a profit or lose value depending on the shape of the interest rate curve in the 20Y to 30Y maturity. If 20Y rates are higher (such as now) than 30Y rates, the fund realizes a loss of value because it sells 20Y Treasuries at a lower price (higher yield) and buys 30Y papers at a higher price (lower yield). If this yield difference is small, such as now (~20 basis points), the fund loses approximately 0.4% p.a. of its entire value (provided that it has to sell ~9% of all assets per year if we assume evenly spread maturities between 20 and 30 years, which is 11 years in total). A full percentage point difference in 20Y and 30Y yields would mean a loss of ~2% per year. On the other hand, if the yield curve has a natural positive slope (20Y yields lower than 30Y yields), the fund would realize the same gains instead of losses.
The investment in a target-maturity bond or an ETF that holds to maturity bonds with a specific maturity, doesn’t sell any bonds and bears no risk of the shape of the yield curve. However, as their maturity shortens in time, their duration falls, and so does the sensitivity to a change in interest rates. Such investments thus automatically "rebalance" your bond position towards a shorter and shorter maturity and duration. This is great if investors want to decrease their exposure to rates as the time passes, but negative if they want to maintain constant exposure to interest rates.
Downside protection and extra yield
Depending on specific needs, investors may consider buying a put option insurance against large losses if they invest via an ETF that has options. While implied volatility is high, out of money put options with a strike price 10% or more below the current price, have a decent price. On the contrary, out of money call options are expensive. Selling covered calls on the long ETF position should be considered for extra yield, however this of course cuts the upside if rates fall more than expected by the call’s strike price.
Conclusion
I believe the current situation of ~5% interest rates on the long end of the US Treasury curve presents a very attractive risk-reward opportunity. The current bear market in long-dated US interest rates is in its third year (a historical record in itself). It has already been as brutal as the stock market rout of 2008-2009, both in its length, as well as the speed and the total percentage of the losses. The current 5% level is a place prone for a major battleground between beaten-down bulls and bears anxious to book at least some profits.
Investment is possible for example via a constant-maturity ETF, such as TLT, or via holding specific bonds to maturity, or by buying a target-maturity bond ETFs. The choice depends on specific needs of investors. An investment in constant-maturity fund, such as TLT, bears additional risk or benefit depending on the shape of the yield curve. A positive term premium, where yields rise with rising maturities over 20 years, is beneficial.
This article was written by

MPORTANT DISCLAIMER: Martin is not a Registered Investment Advisor, Broker/Dealer, Securities Broker or Financial Planner. The Information on SeekingAlpha.com or elsewhere is provided for information purposes only. The Information is not intended to be and does not constitute financial advice or any other advice, is general in nature and not specific to any individual. Before using Martin's information to make an investment decision, you should seek the advice of a qualified and registered securities professional and undertake your own due diligence. None of the information provided by Martin is intended as investment advice, as an offer or solicitation of an offer to buy or sell, or as a recommendation, endorsement, or sponsorship of any security, company, or fund. Martin is not responsible for any investment decision made by you. You are responsible for your own investment research and investment decisions.
Analyst’s Disclosure: I/we have a beneficial long position in the shares of TLT either through stock ownership, options, or other derivatives. I wrote this article myself, and it expresses my own opinions. I am not receiving compensation for it (other than from Seeking Alpha). I have no business relationship with any company whose stock is mentioned in this article.
Seeking Alpha's Disclosure: Past performance is no guarantee of future results. No recommendation or advice is being given as to whether any investment is suitable for a particular investor. Any views or opinions expressed above may not reflect those of Seeking Alpha as a whole. Seeking Alpha is not a licensed securities dealer, broker or US investment adviser or investment bank. Our analysts are third party authors that include both professional investors and individual investors who may not be licensed or certified by any institute or regulatory body.
| Symbol | Last Price | % Chg |
|---|---|---|
| - | - | |